Incident Dashboard
Route: /drm · Edition: Community+
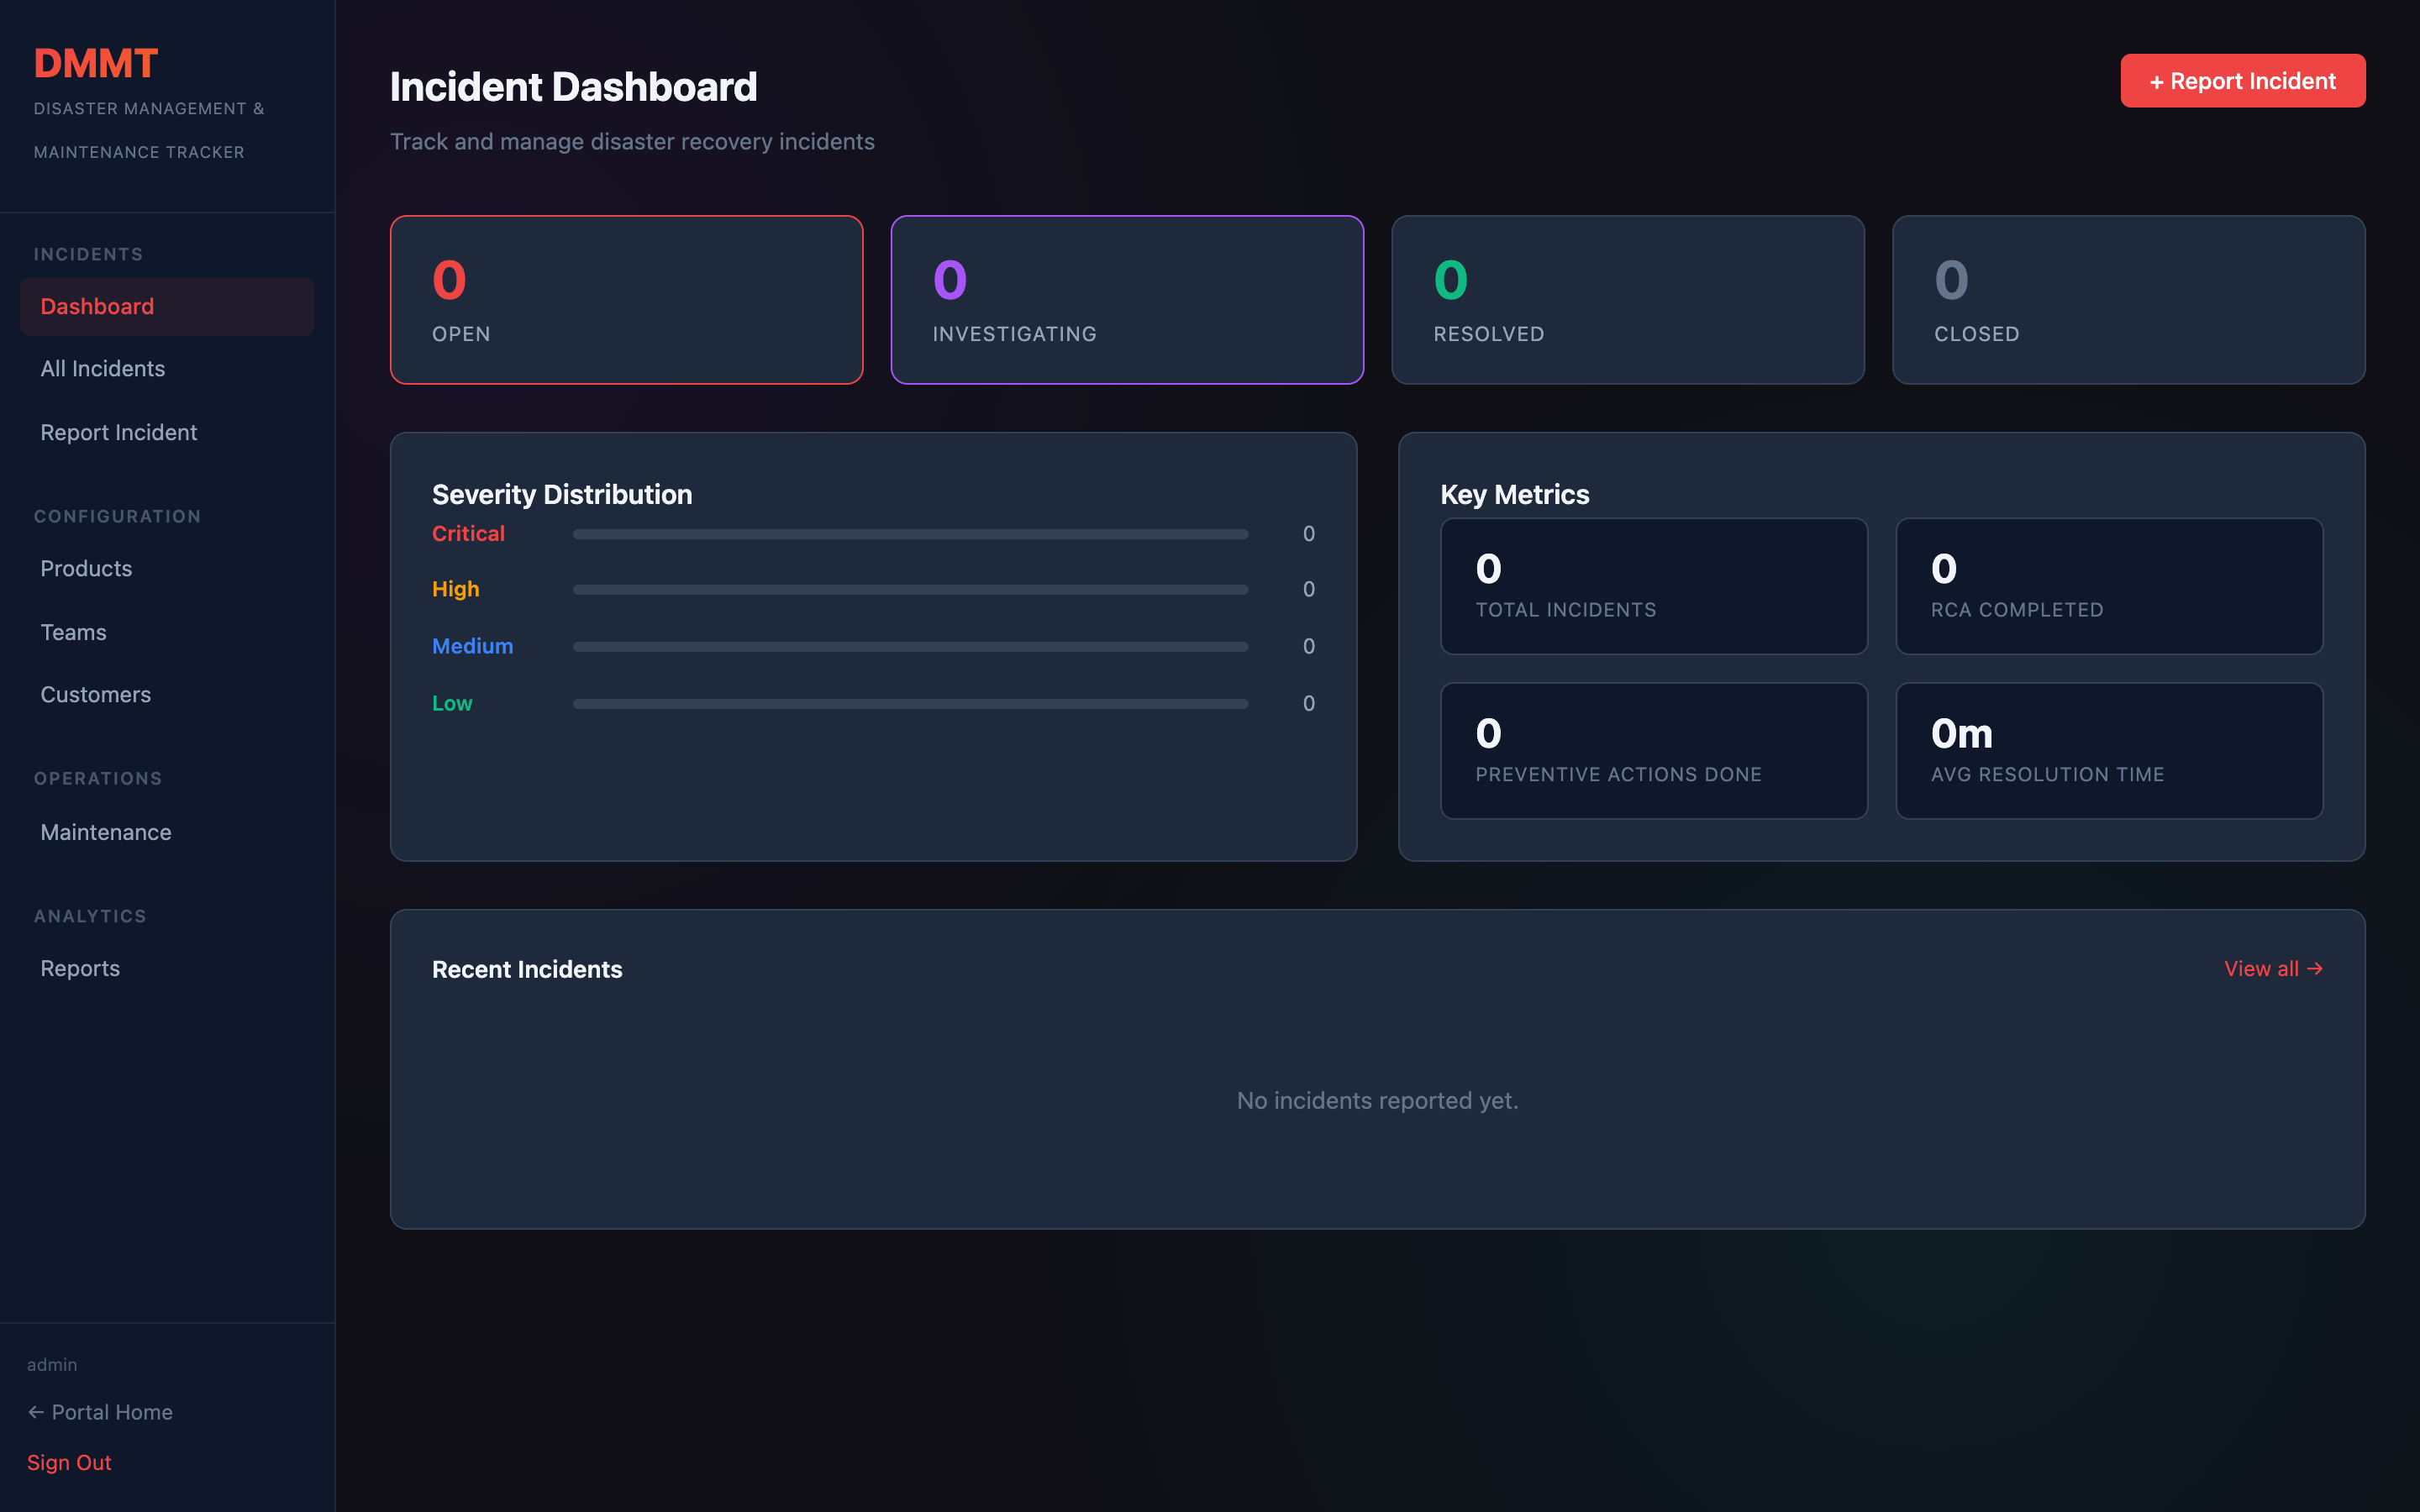
The DRM (Disaster & Maintenance Tracker) dashboard gives a real-time overview of all active and historical incidents, their severity distribution, and key operational metrics.
Status cards
Four cards at the top show incident counts by lifecycle stage:
| Card | Meaning |
|---|---|
| Open | Incidents acknowledged but not yet resolved |
| Investigating | Actively being diagnosed |
| Resolved | Root cause identified, fix applied |
| Closed | Post-mortem complete, RCA filed |
Severity distribution
A horizontal bar chart breaks down incidents by severity — Critical, High, Medium, and Low — so you can spot concentration risk at a glance.
Key metrics
| Metric | Description |
|---|---|
| Total Incidents | All incidents ever recorded |
| RCA Completed | Incidents with a filed root cause analysis |
| Preventive Actions Done | Action items marked complete |
| Avg Resolution Time | Mean time to resolution across closed incidents |
Recent incidents
The bottom panel lists the most recent incidents with severity, status, and affected products — click any row to open the full incident detail.